Session Info
from table
Status:
Completed
Progress
10 / 10 steps completed
Quick Actions
Dataset Overview
557
Rows19
ColumnsColumn Types
Column Information
| Column | Type | Non-Null Count | Missing % | Unique Values |
|---|---|---|---|---|
| Trial_code | object | 552 | 0.9% | 14 |
| P24003_CAGE | object | 551 | 1.1% | 551 |
| Unnamed__2 | object | 551 | 1.1% | 21 |
| Unnamed__3 | object | 541 | 2.9% | 61 |
| Unnamed__4 | object | 241 | 56.7% | 108 |
| Unnamed__5 | object | 1 | 99.8% | 1 |
| Unnamed__6 | object | 31 | 94.4% | 1 |
| Unnamed__7 | object | 2 | 99.6% | 2 |
| Number_of_animals_arrived_ | object | 5 | 99.1% | 5 |
| Unnamed__9 | object | 1 | 99.8% | 1 |
| Unnamed__10 | object | 1 | 99.8% | 1 |
| Unnamed__11 | object | 1 | 99.8% | 1 |
| Unnamed__12 | object | 1 | 99.8% | 1 |
| Unnamed__13 | float64 | 0 | 100.0% | 0 |
| Trial_code_1 | object | 552 | 0.9% | 14 |
| P24003_CAGE_1 | object | 545 | 2.2% | 545 |
| Unnamed__16 | object | 545 | 2.2% | 15 |
| Unnamed__17 | object | 541 | 2.9% | 61 |
| Unnamed__18 | object | 241 | 56.7% | 108 |
SQL Query
No SQL query found for this session. This might be a CSV upload or the query information was not stored.
Ask Your Question
Analysis History
Select for context:
Analysis 1
perform some descriptive statistics and some summary plotting of the data in this dataset.
2026-02-10 14:45:34 • 15 files
Debug: Found 15 generated files (1 scripts)
Generated Visualizations
Generated visualization
plot_02_missing_data_percentage.png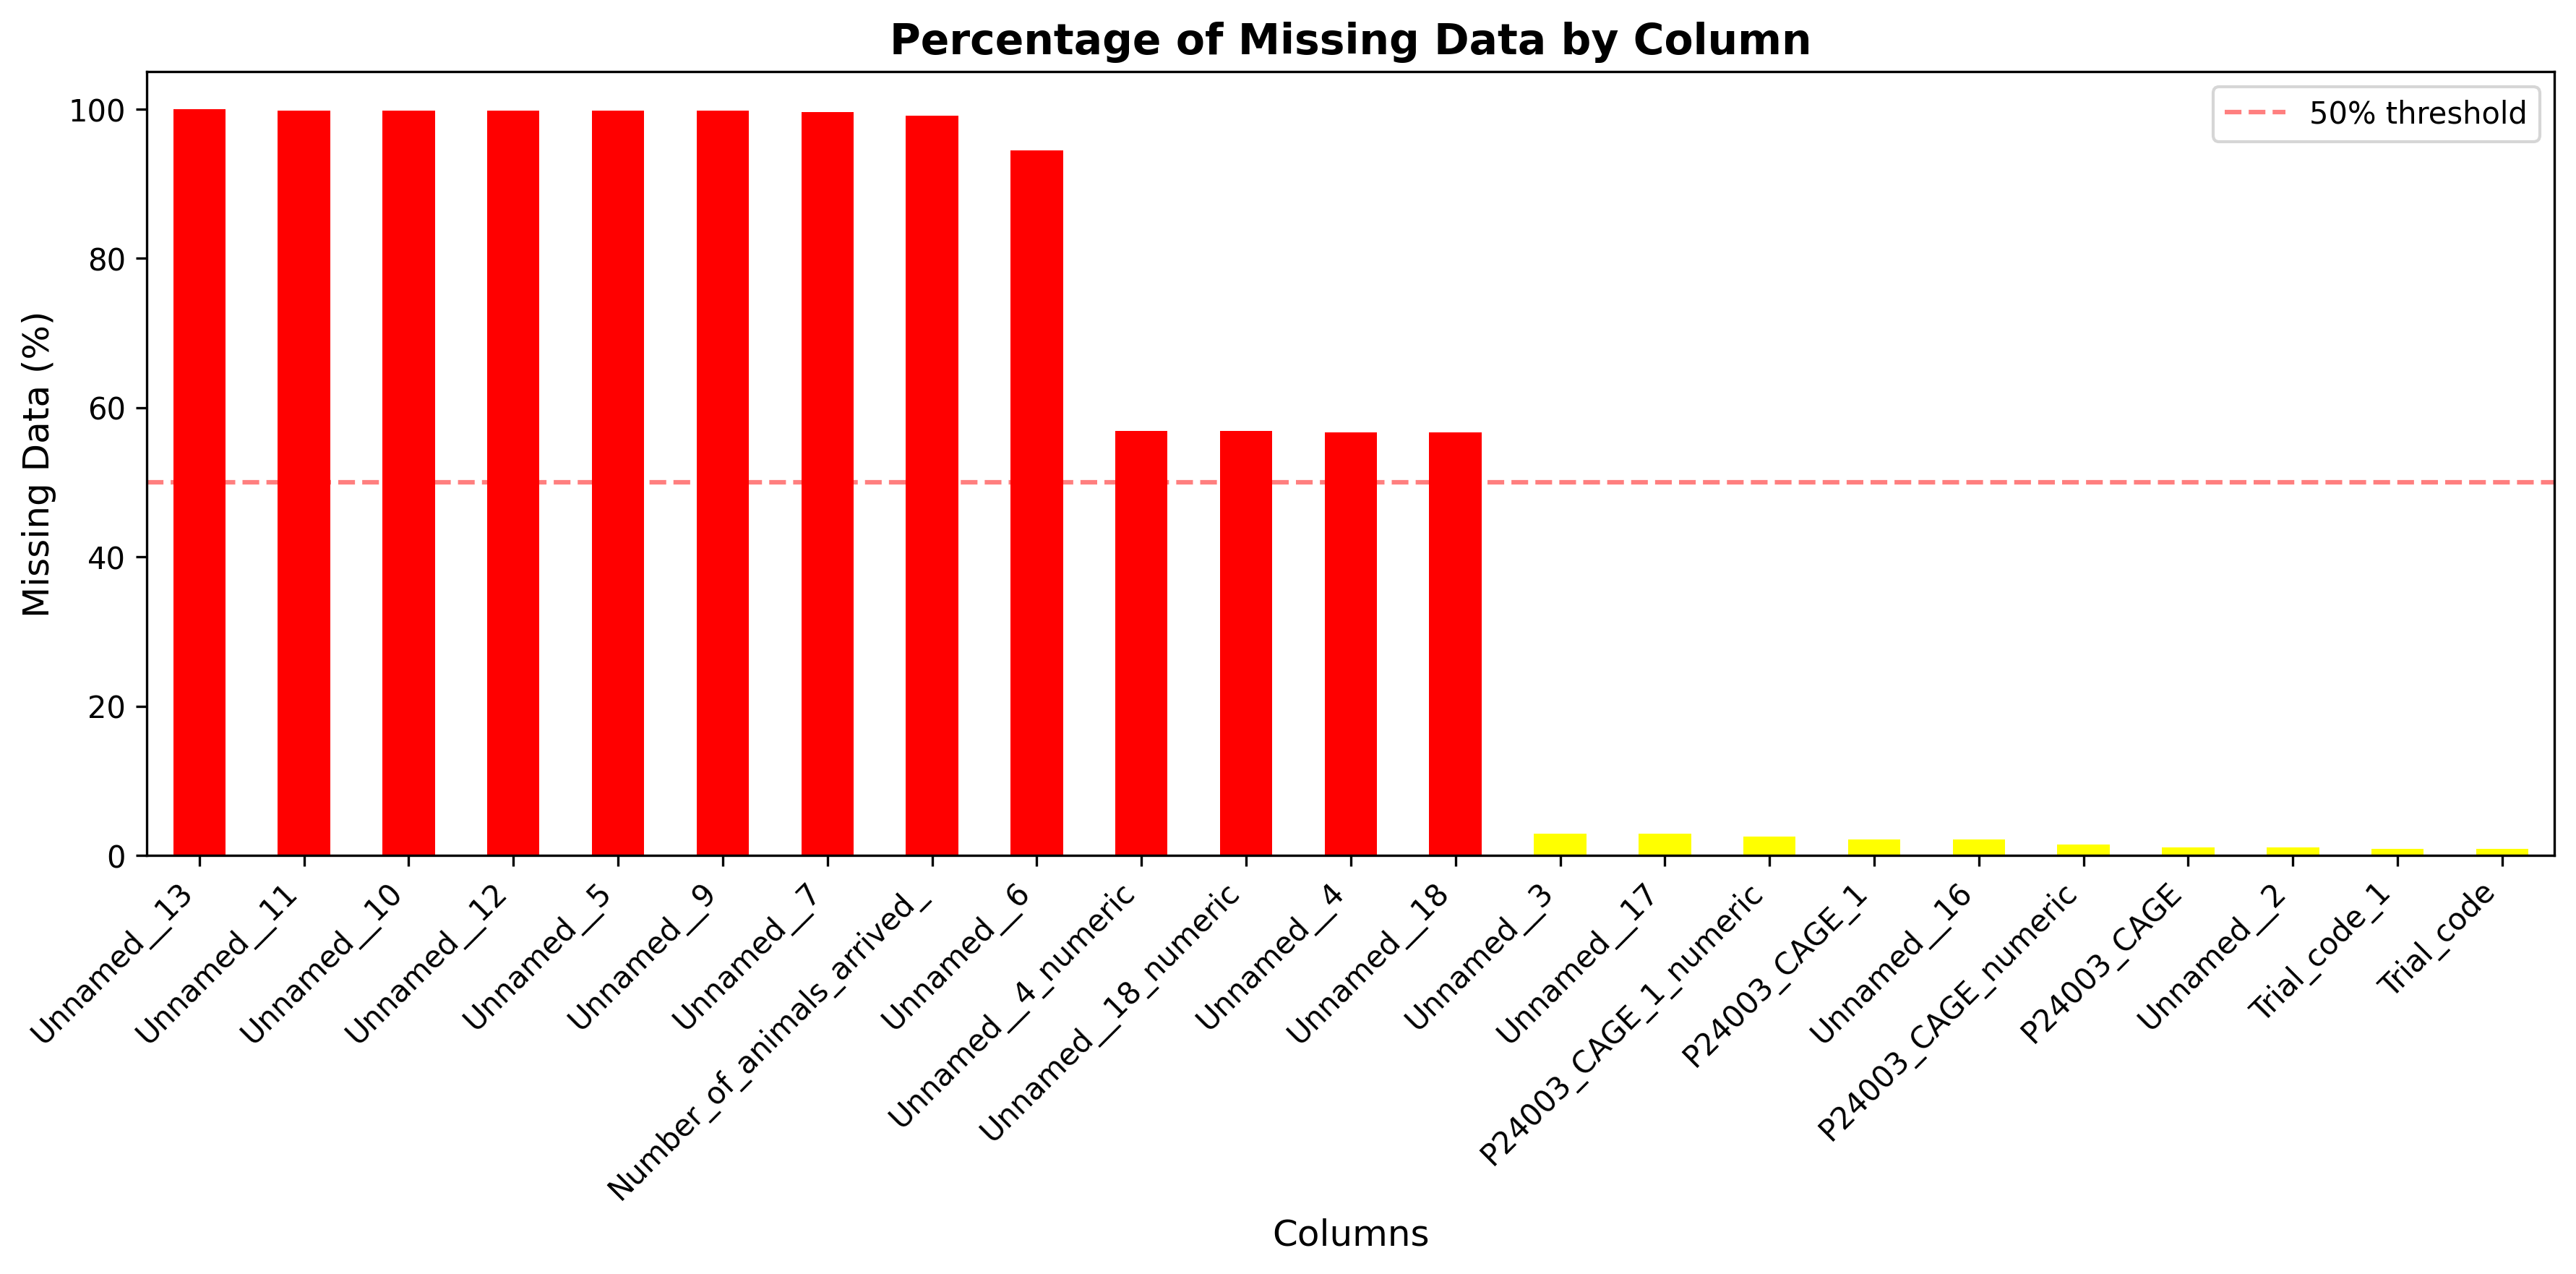
Generated visualization
plot_01_missing_data_heatmap.png
Generated visualization
plot_03_numeric_distributions.png
Generated visualization
plot_06_data_completeness.png
Generated visualization
plot_04_categorical_frequencies.png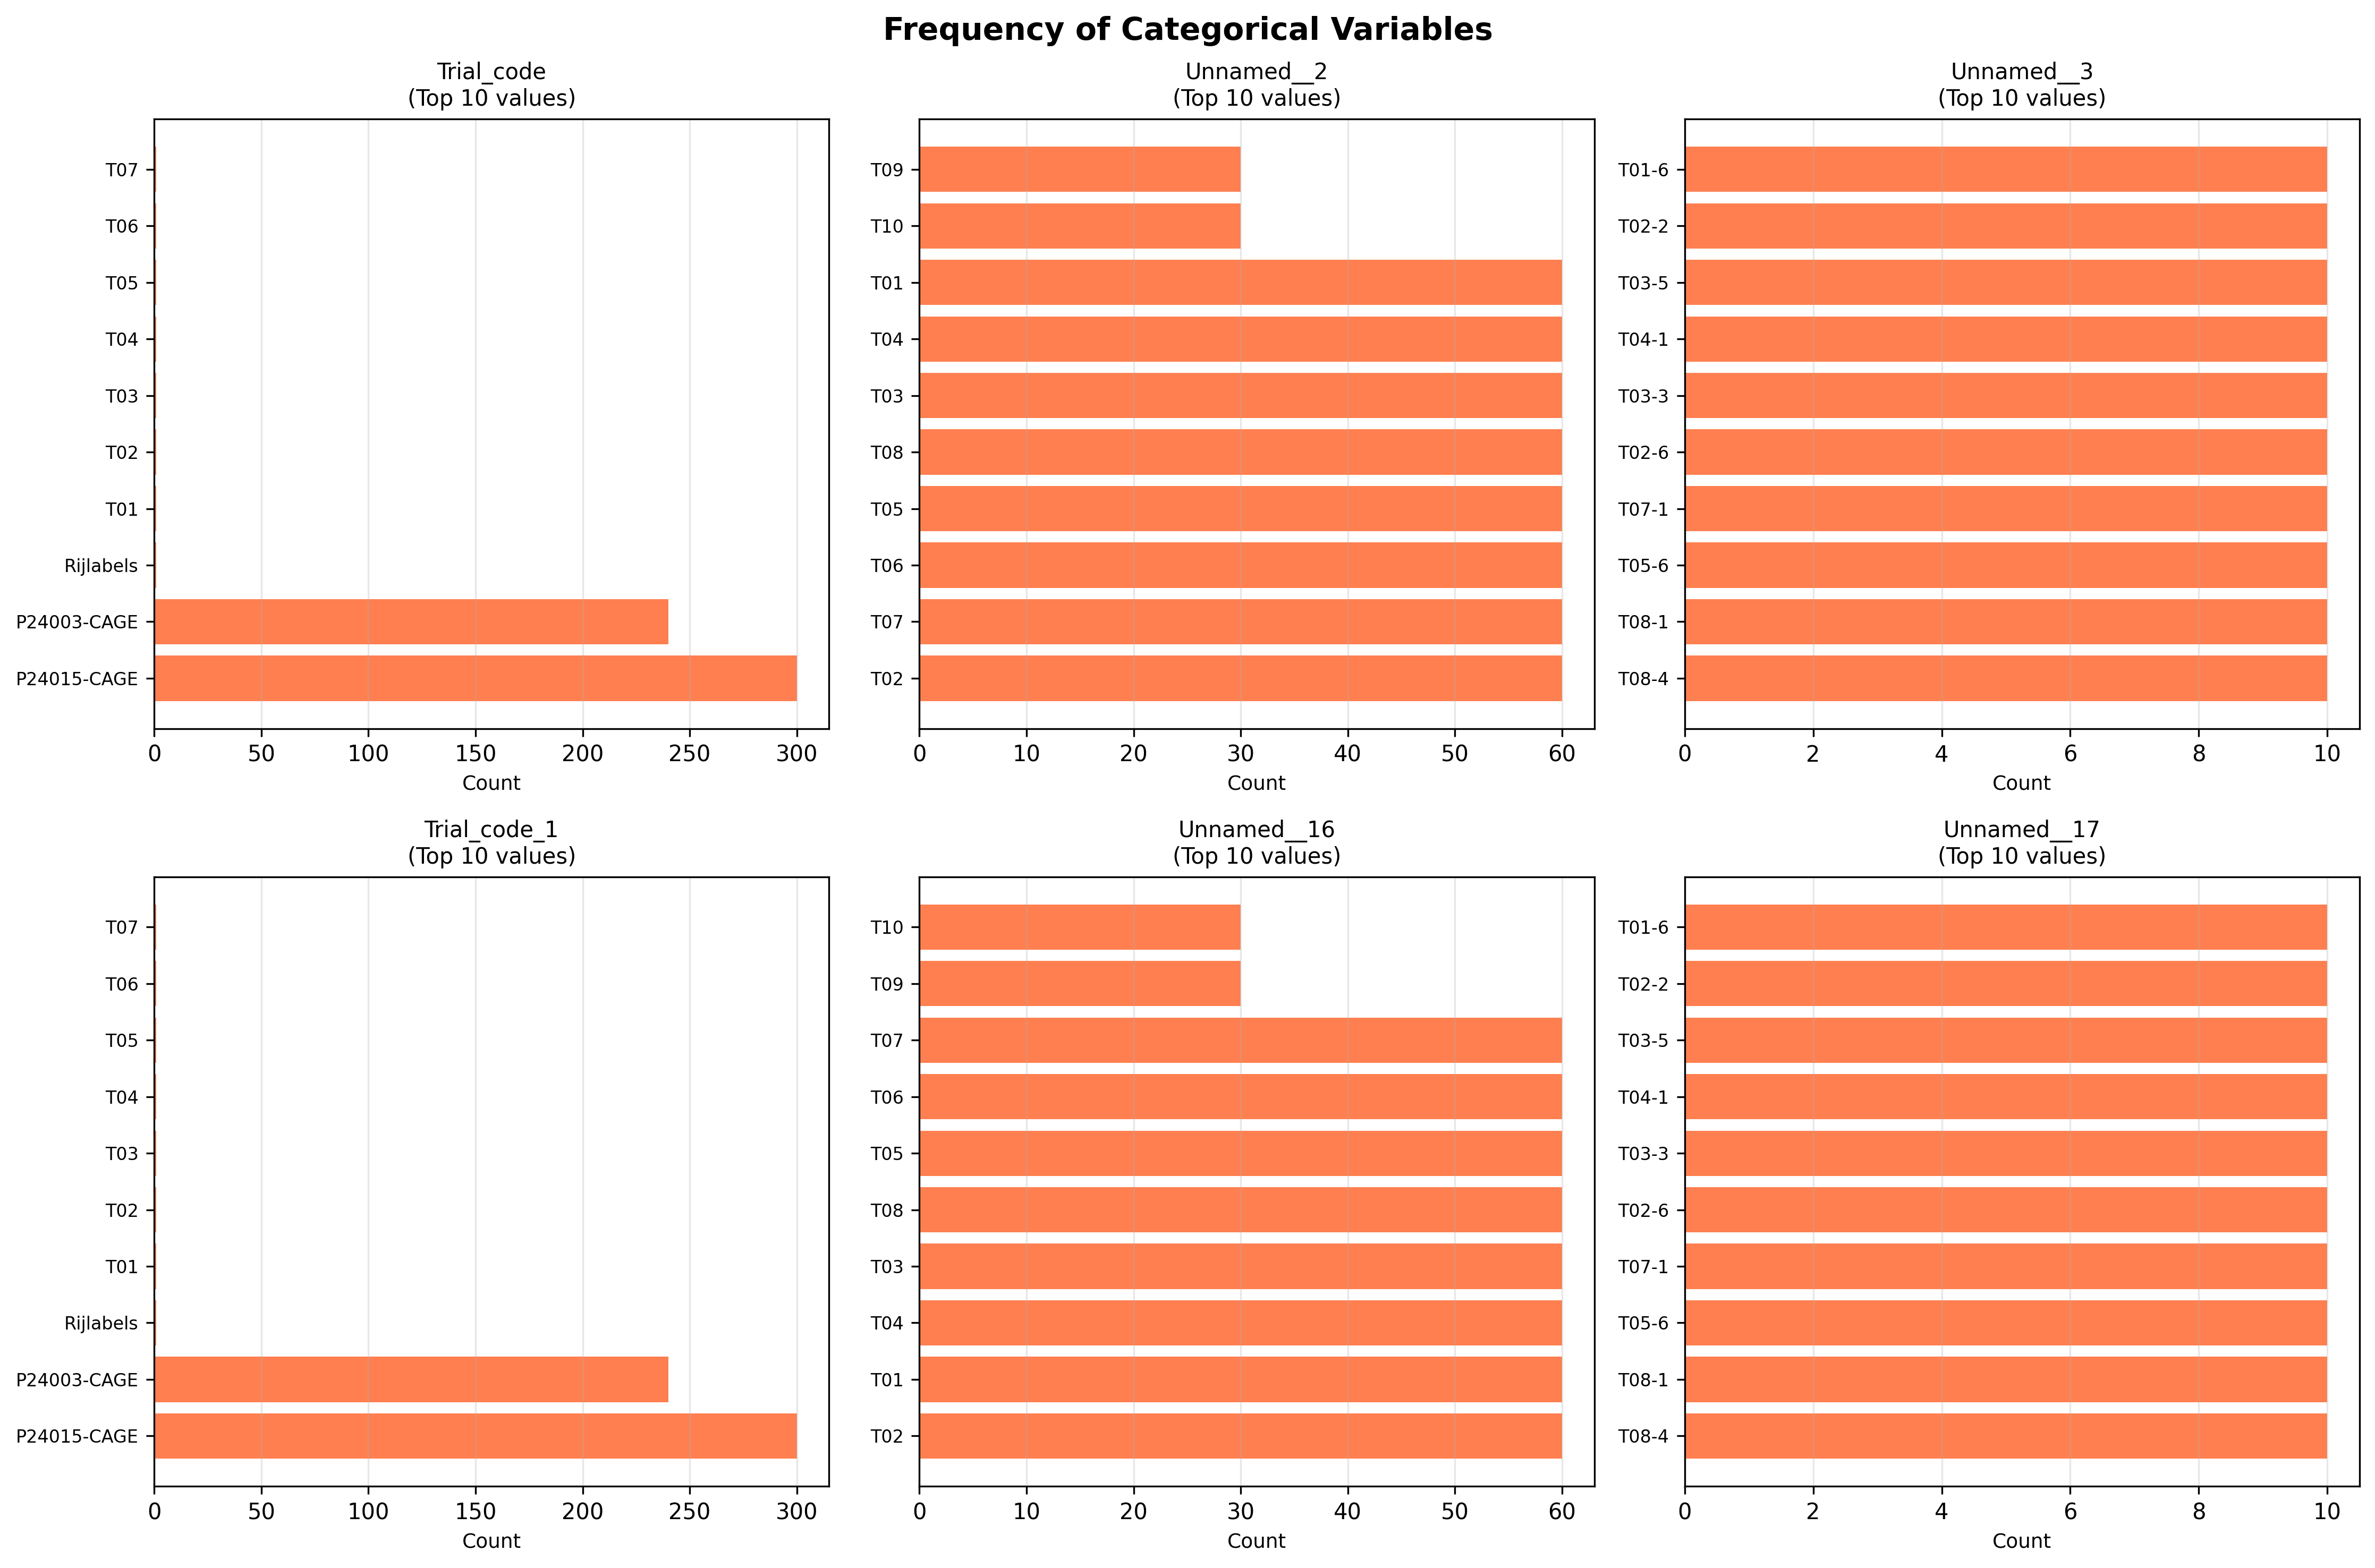
Generated visualization
plot_05_correlation_heatmap.png
Generated Tables
Data table or results
input_data.csvTrial_code,P24003_CAGE,Unnamed__2,Unnamed__3,Unnamed__4,Unnamed__5,Unnamed__6,Unnamed__7,Number_of_animals_arrived_,Unnamed__9,Unnamed__10,Unnamed__11,Unnamed__12,Unnamed__13,Trial_code_1,P24003_CAGE_1,Unnamed__16,Unnamed__17,Unnamed__18 ,,,,,,,,Number of animals included:,,,,,,,,,, Rijlabels,Gemiddelde van Weight,Stdev van Weight,,,,,,,,,,,,Rijlabels,Gemiddelde van Weight,Stdev van Weight,, T01,328.3666666666667,37.49619137747321,,,,,,Number of animals remaining: ,,,,,,T01,382.3,173.24423992348...
Data table or results
table_02_numeric_descriptive_statistics.csv,count,mean,std,min,25%,50%,75%,max,missing,missing_pct,skewness,kurtosis P24003_CAGE_numeric,549.0,2368.1674863387975,1500.7842026742517,326.3333333333333,749.0,3607.0,3744.0,3881.0,8,1.436265709156194,-0.18830724514127697,-1.9545142260056048 Unnamed__4_numeric,240.0,328.21666666666664,31.786732669144172,248.0,306.0,329.0,347.0,419.0,317,56.91202872531418,0.21785219614645684,0.05437759445232926 Unnamed__13,0.0,,,,,,,,557,100.0,, P24003_CAGE_1_numeric,543.0,2391.0707796193983,1493.0631268928691,...
Data table or results
table_01_data_quality_summary.csvColumn,Data_Type,Non_Null_Count,Null_Count,Null_Percentage,Unique_Values Trial_code,object,552,5,0.9,14 P24003_CAGE,object,551,6,1.08,551 Unnamed__2,object,551,6,1.08,21 Unnamed__3,object,541,16,2.87,61 Unnamed__4,object,241,316,56.73,108 Unnamed__5,object,1,556,99.82,1 Unnamed__6,object,31,526,94.43,1 Unnamed__7,object,2,555,99.64,2 Number_of_animals_arrived_,object,5,552,99.1,5 Unnamed__9,object,1,556,99.82,1 Unnamed__10,object,1,556,99.82,1 Unnamed__11,object,1,556,99.82,1 Unnamed__12,object,...
Data table or results
table_03_categorical_frequency_summary.csvColumn,Rank,Value,Count,Percentage Trial_code,1,P24015-CAGE,300,53.86 Trial_code,2,P24003-CAGE,240,43.09 Trial_code,3,Rijlabels,1,0.18 Trial_code,4,T01,1,0.18 Trial_code,5,T02,1,0.18 Unnamed__2,1,T02,60,10.77 Unnamed__2,2,T07,60,10.77 Unnamed__2,3,T06,60,10.77 Unnamed__2,4,T05,60,10.77 Unnamed__2,5,T08,60,10.77 Unnamed__3,1,T08-4,10,1.8 Unnamed__3,2,T08-1,10,1.8 Unnamed__3,3,T05-6,10,1.8 Unnamed__3,4,T07-1,10,1.8 Unnamed__3,5,T02-6,10,1.8 Trial_code_1,1,P24015-CAGE,300,53.86 Trial_code_1,2,P2400...
Data table or results
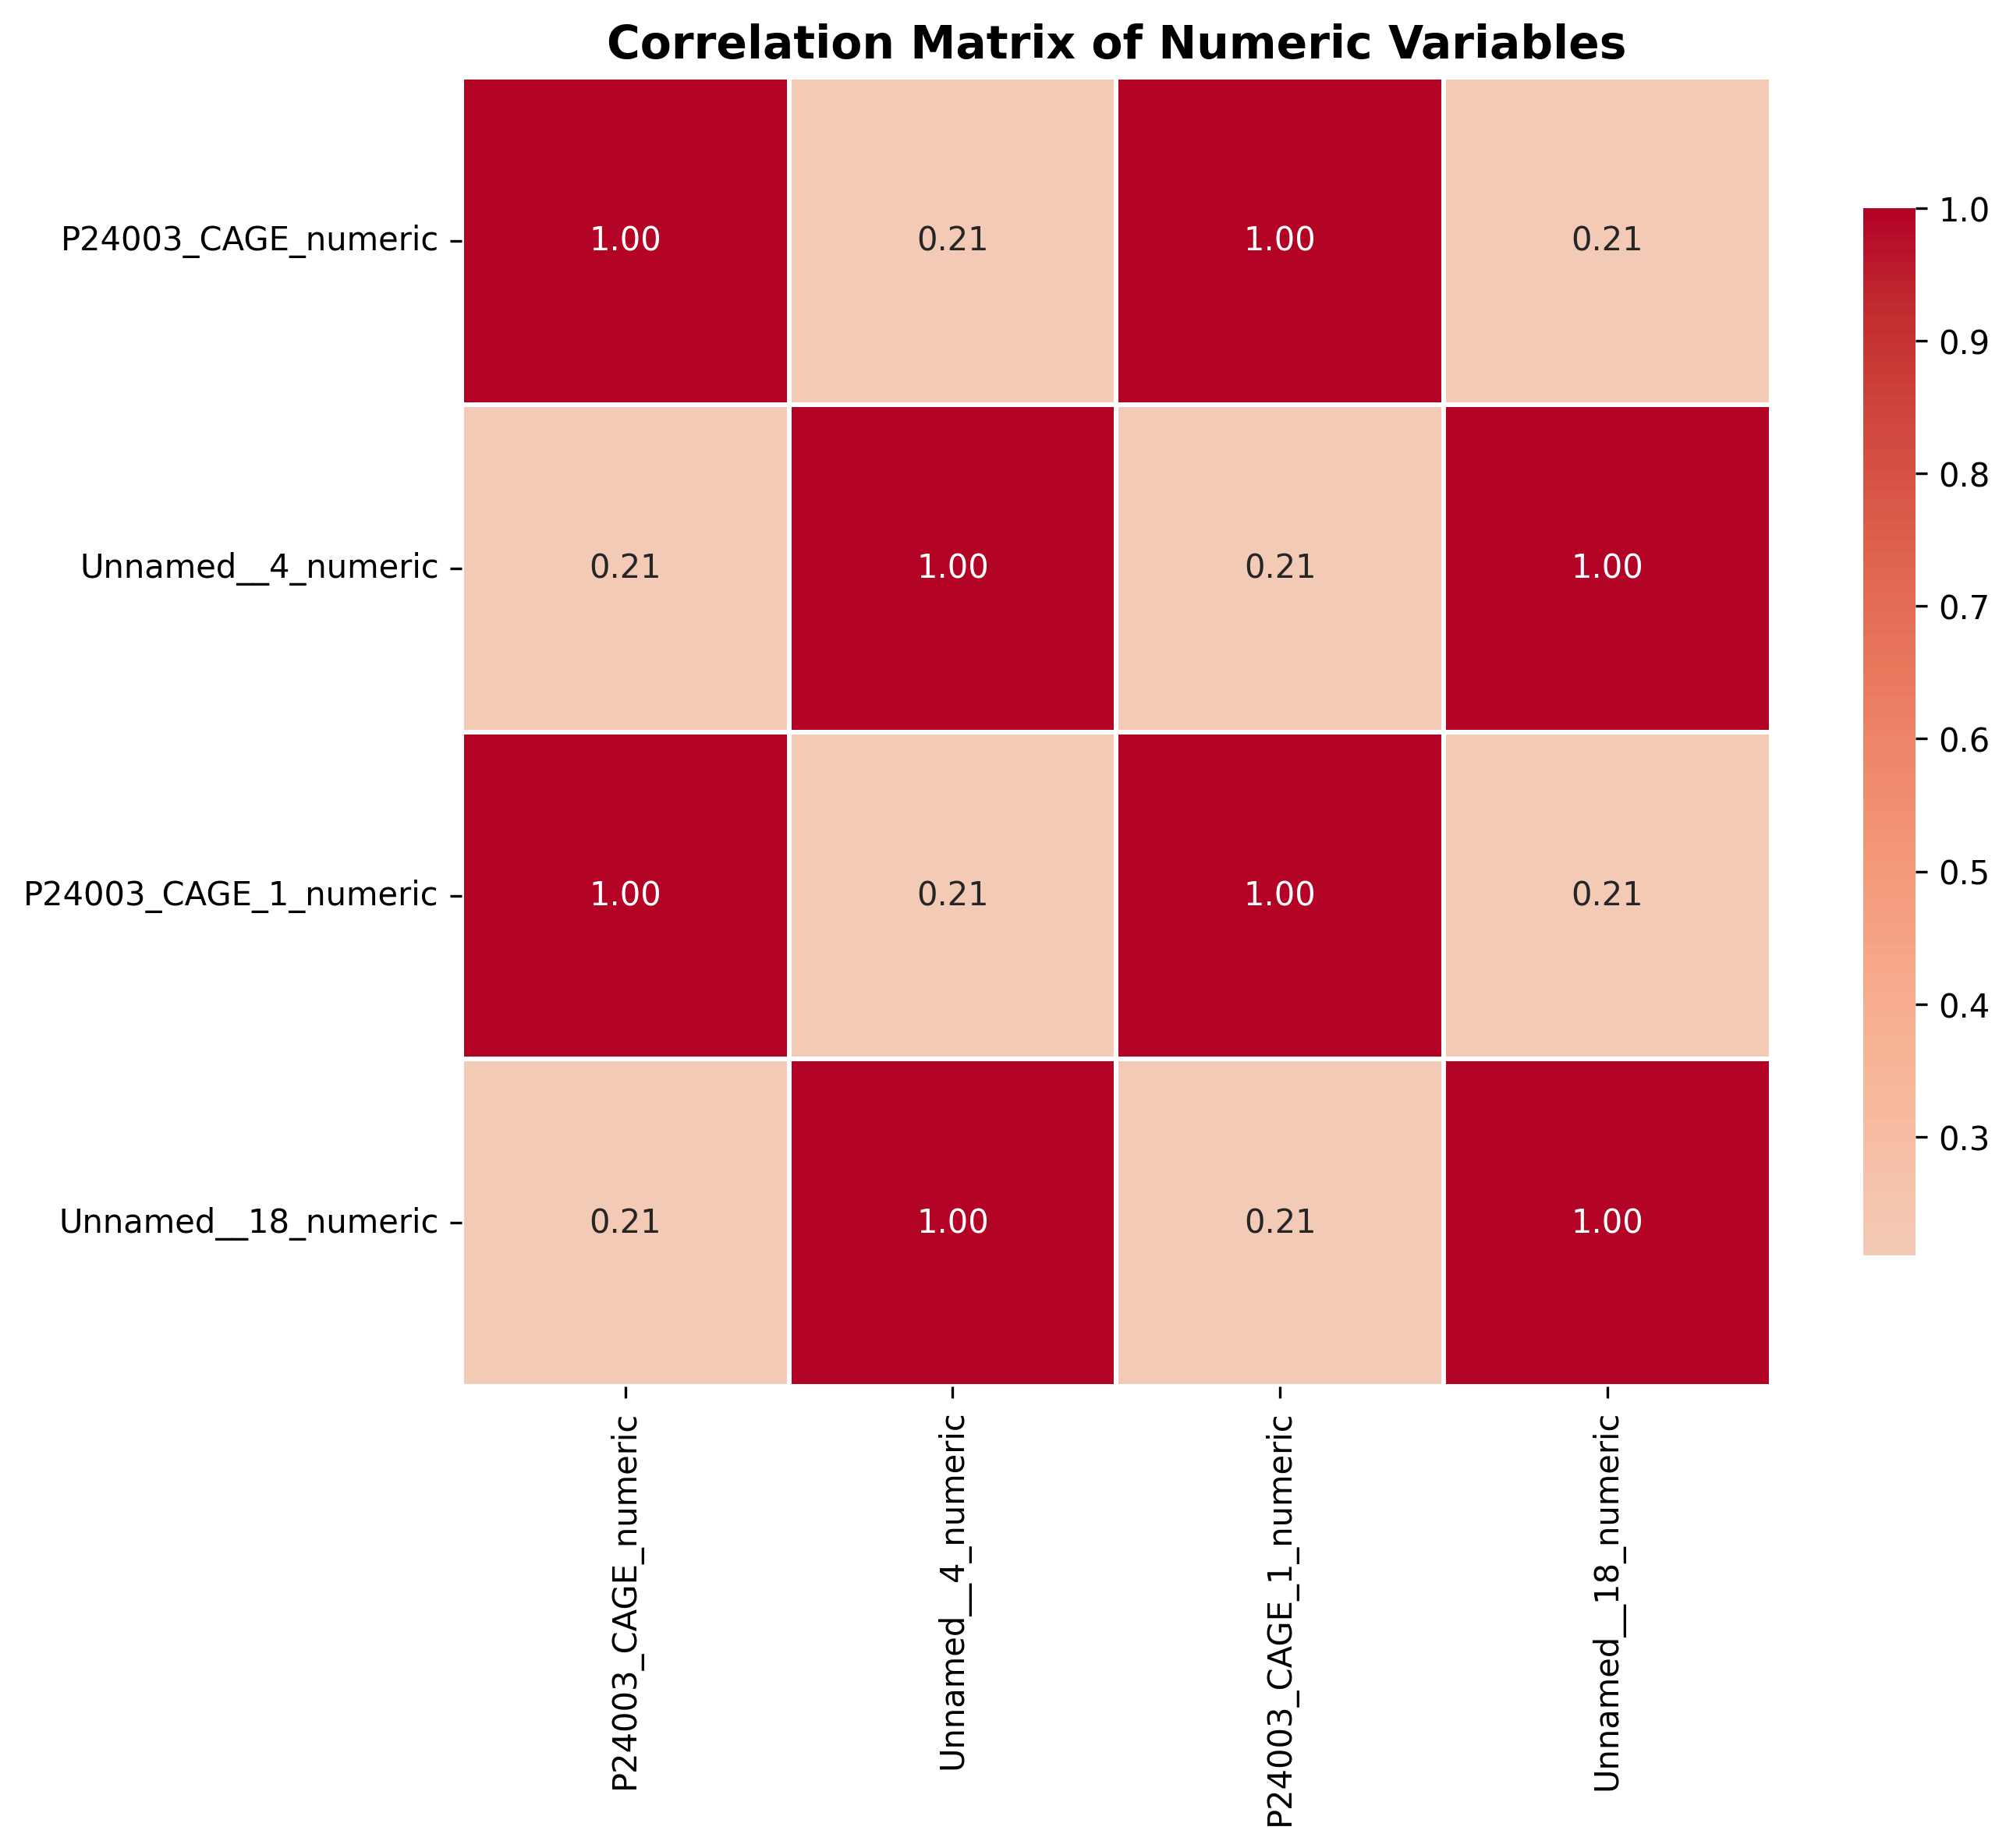
table_04_correlation_matrix.csv,P24003_CAGE_numeric,Unnamed__4_numeric,P24003_CAGE_1_numeric,Unnamed__18_numeric P24003_CAGE_numeric,1.0,0.2103812186275313,0.9999946188893679,0.2103812186275313 Unnamed__4_numeric,0.2103812186275313,1.0,0.21038121862753129,1.0 P24003_CAGE_1_numeric,0.9999946188893679,0.21038121862753129,1.0,0.2103812186275313 Unnamed__18_numeric,0.2103812186275313,1.0,0.2103812186275313,1.0
Data table or results
table_05_overall_dataset_summary.csvMetric,Value Total Rows,557.0 Total Columns,23.0 Numeric Columns,5.0 Categorical Columns,18.0 Total Missing Values,6336.0 Missing Data Percentage,49.46 Complete Rows,0.0 Complete Rows Percentage,0.0
Analysis Conclusions
Analysis conclusions and insights
conclusions.txt
================================================================================
DESCRIPTIVE STATISTICS AND SUMMARY ANALYSIS
================================================================================
Dataset Shape: 557 rows × 19 columns
DATA QUALITY SUMMARY
--------------------------------------------------------------------------------
Total columns: 19
Columns with >50% missing data: 11
Columns with >90% missing data: 9
Columns with high missing data (>50%): Unnamed__4, Unnamed__5, Unnamed__6, Unnamed__7, Number_of_animals_arrived_, Unnamed__9, Unnamed__10, Unnamed__11, Unnamed__12, Unnamed__13, Unnamed__18
NUMERIC VARIABLES ANALYSIS
--------------------------------------------------------------------------------
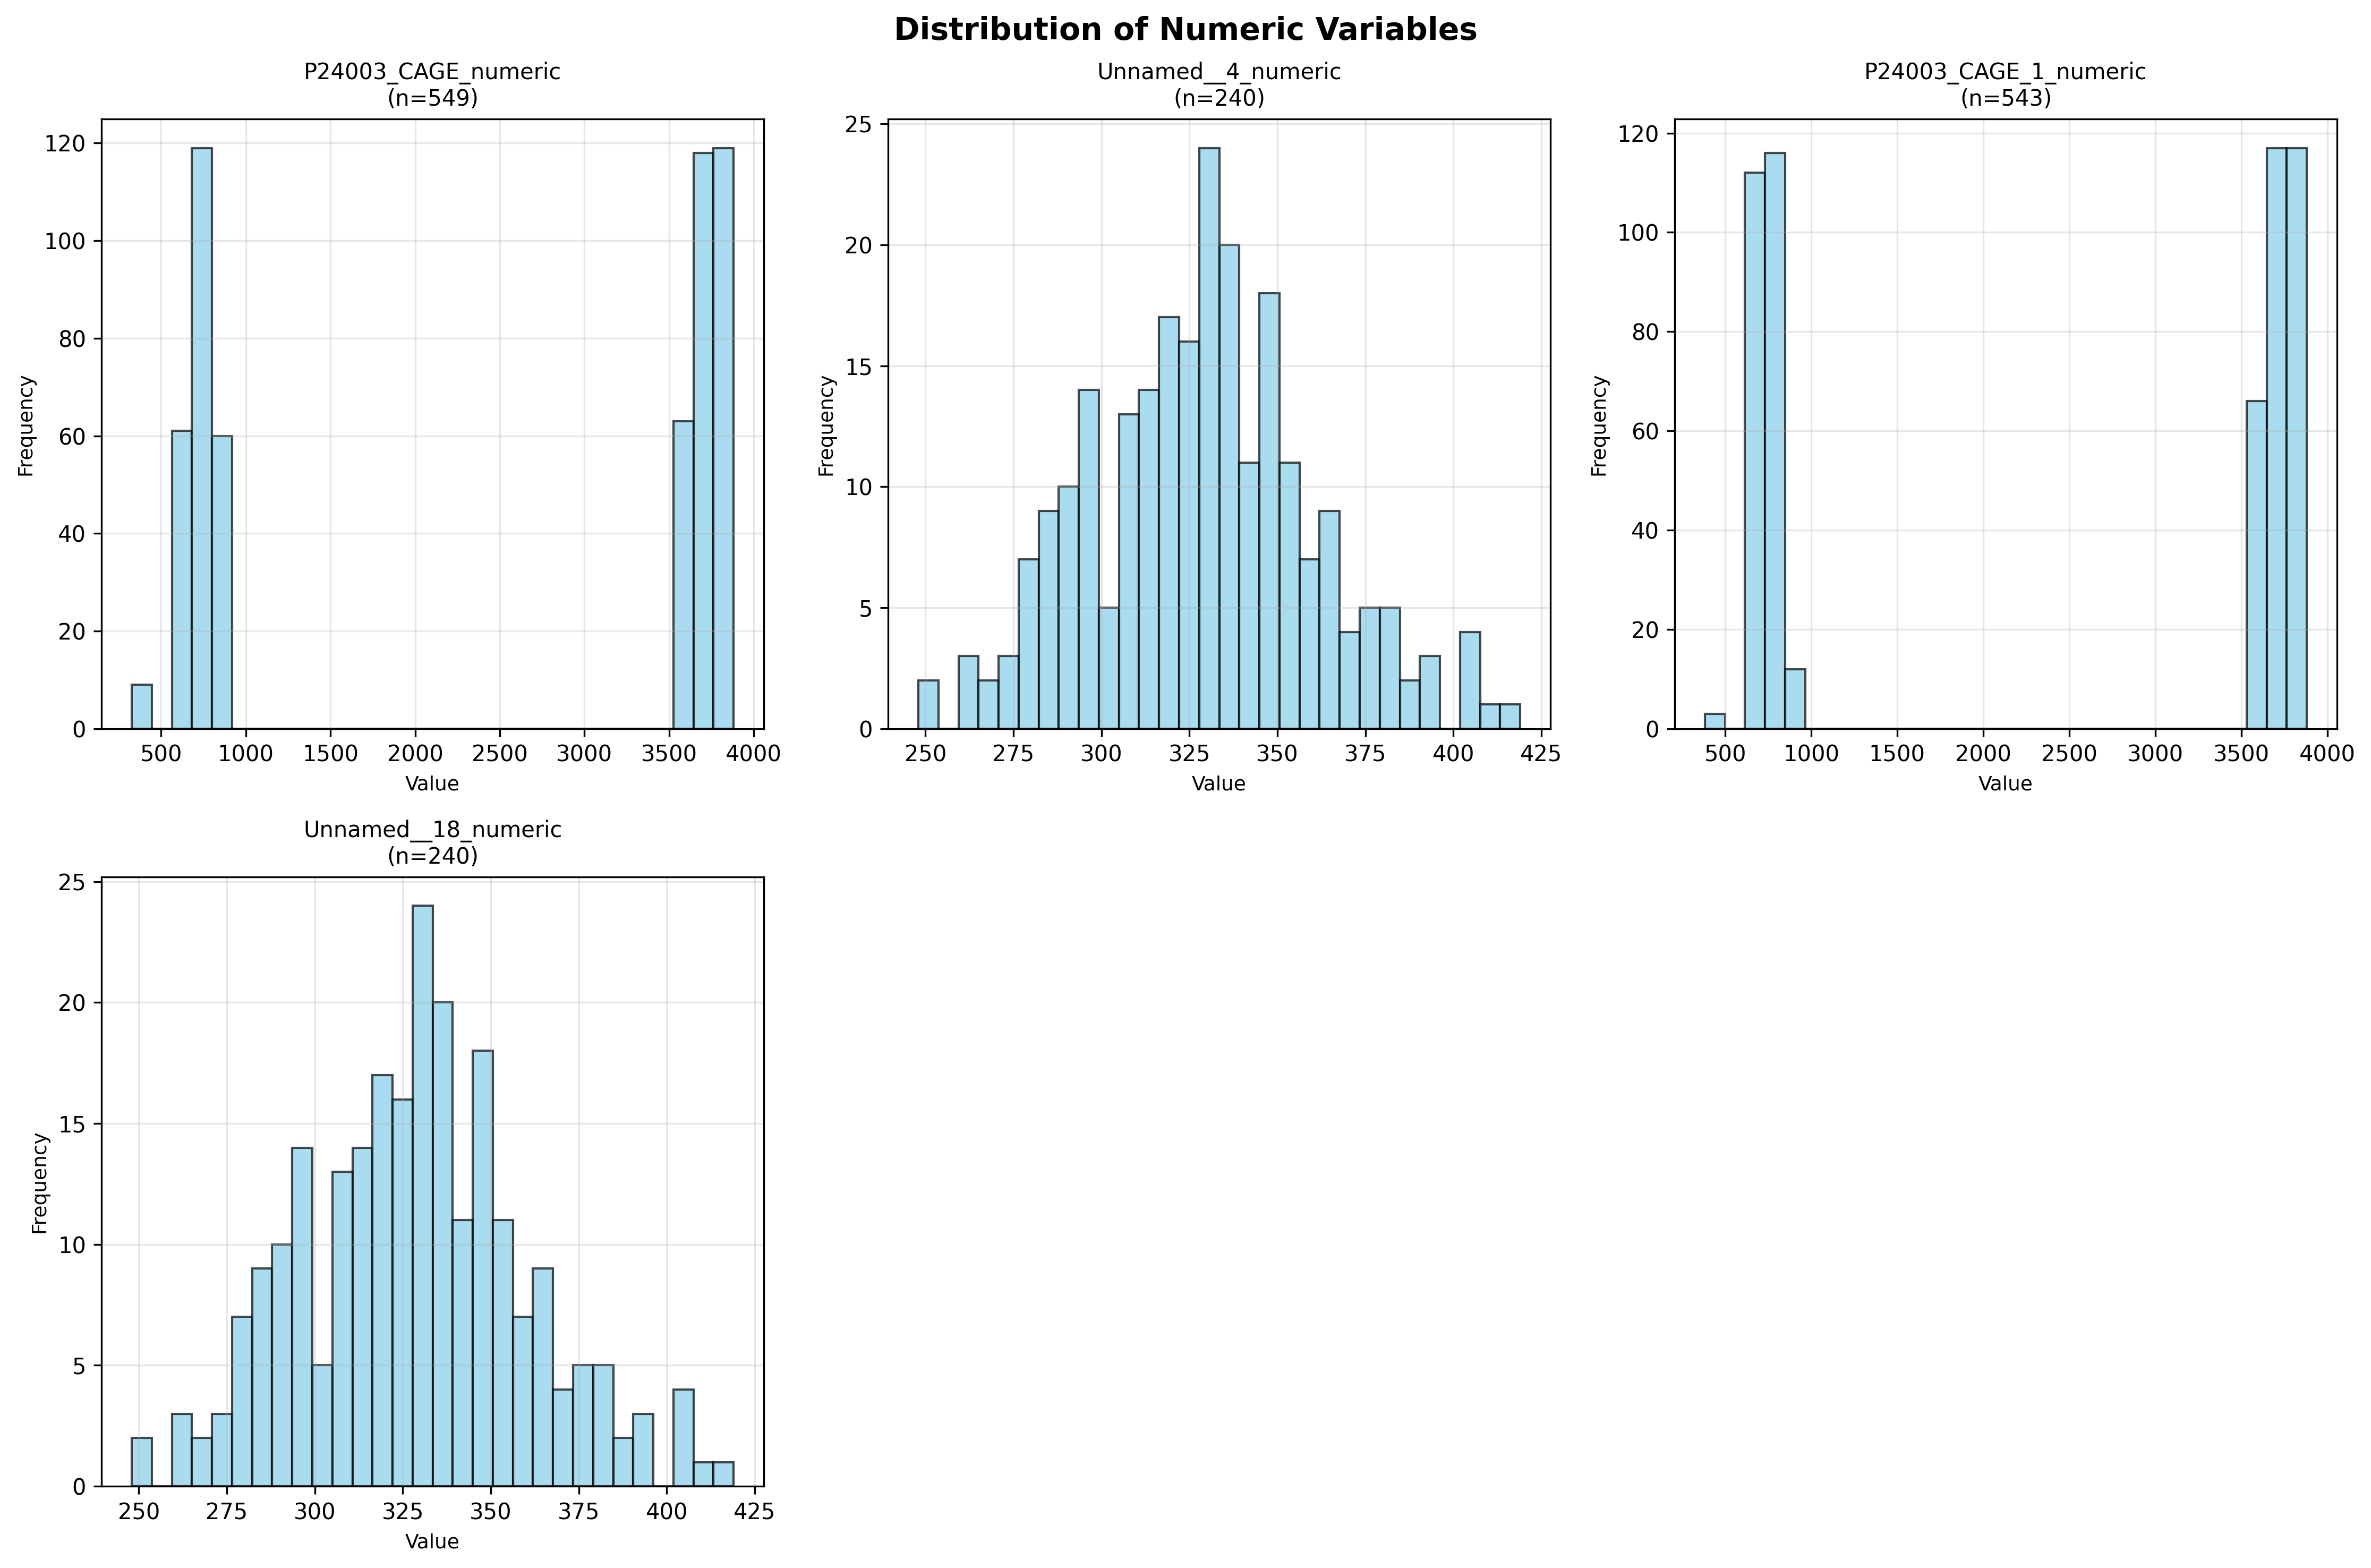
Number of numeric columns analyzed: 5
P24003_CAGE_numeric:
Mean: 2368.17
Median: 3607.00
Std Dev: 1500.78
Range: [326.33, 3881.00]
Missing: 8 (1.4%)
Unnamed__4_numeric:
Mean: 328.22
Median: 329.00
Std Dev: 31.79
Range: [248.00, 419.00]
Missing: 317 (56.9%)
P24003_CAGE_1_numeric:
Mean: 2391.07
Median: 3610.00
Std Dev: 1493.06
Range: [382.30, 3881.00]
Missing: 14 (2.5%)
Unnamed__18_numeric:
Mean: 328.22
Median: 329.00
Std Dev: 31.79
Range: [248.00, 419.00]
Missing: 317 (56.9%)
CATEGORICAL VARIABLES ANALYSIS
--------------------------------------------------------------------------------
Number of categorical columns analyzed: 6
Trial_code:
Unique values: 14
Most frequent: 'P24015-CAGE' (300 occurrences)
Missing: 5 (0.9%)
Unnamed__2:
Unique values: 21
Most frequent: 'T02' (60 occurrences)
Missing: 6 (1.1%)
Unnamed__3:
Unique values: 61
Most frequent: 'T08-4' (10 occurrences)
Missing: 16 (2.9%)
Trial_code_1:
Unique values: 14
Most frequent: 'P24015-CAGE' (300 occurrences)
Missing: 5 (0.9%)
Unnamed__16:
Unique values: 15
Most frequent: 'T02' (60 occurrences)
Missing: 12 (2.2%)
OVERALL DATASET SUMMARY
--------------------------------------------------------------------
DESCRIPTIVE STATISTICS AND SUMMARY ANALYSIS
================================================================================
Dataset Shape: 557 rows × 19 columns
DATA QUALITY SUMMARY
--------------------------------------------------------------------------------
Total columns: 19
Columns with >50% missing data: 11
Columns with >90% missing data: 9
Columns with high missing data (>50%): Unnamed__4, Unnamed__5, Unnamed__6, Unnamed__7, Number_of_animals_arrived_, Unnamed__9, Unnamed__10, Unnamed__11, Unnamed__12, Unnamed__13, Unnamed__18
NUMERIC VARIABLES ANALYSIS
--------------------------------------------------------------------------------
Number of numeric columns analyzed: 5
P24003_CAGE_numeric:
Mean: 2368.17
Median: 3607.00
Std Dev: 1500.78
Range: [326.33, 3881.00]
Missing: 8 (1.4%)
Unnamed__4_numeric:
Mean: 328.22
Median: 329.00
Std Dev: 31.79
Range: [248.00, 419.00]
Missing: 317 (56.9%)
P24003_CAGE_1_numeric:
Mean: 2391.07
Median: 3610.00
Std Dev: 1493.06
Range: [382.30, 3881.00]
Missing: 14 (2.5%)
Unnamed__18_numeric:
Mean: 328.22
Median: 329.00
Std Dev: 31.79
Range: [248.00, 419.00]
Missing: 317 (56.9%)
CATEGORICAL VARIABLES ANALYSIS
--------------------------------------------------------------------------------
Number of categorical columns analyzed: 6
Trial_code:
Unique values: 14
Most frequent: 'P24015-CAGE' (300 occurrences)
Missing: 5 (0.9%)
Unnamed__2:
Unique values: 21
Most frequent: 'T02' (60 occurrences)
Missing: 6 (1.1%)
Unnamed__3:
Unique values: 61
Most frequent: 'T08-4' (10 occurrences)
Missing: 16 (2.9%)
Trial_code_1:
Unique values: 14
Most frequent: 'P24015-CAGE' (300 occurrences)
Missing: 5 (0.9%)
Unnamed__16:
Unique values: 15
Most frequent: 'T02' (60 occurrences)
Missing: 12 (2.2%)
OVERALL DATASET SUMMARY
--------------------------------------------------------------------
Generated Scripts
Generated Python analysis script
analysis.py
Content length: 20480
#!/usr/bin/env python3
"""
Statistical Analysis Script
Generated by SmartStat Agent
Query: perform some descriptive statistics and some summary plotting of the data in this dataset.
Generated: 2026-02-10T14:41:48.058888
"""
import pandas as pd
import numpy as np
import matplotlib.pyplot as plt
import seaborn as sns
from scipy import stats
import warnings
warnings.filterwarnings('ignore')
def main():
print("Starting statistical analysis...")
print(f"Query: perform some descriptive statistics and some summary plotting of the data in this dataset.")
# Load data
try:
df = pd.read_csv('input_data.csv')
print(f"Data loaded successfully: {df.shape}")
except Exception as e:
print(f"Error loading data: {e}")
return
# Initialize conclusions file
conclusions = []
conclusions.append("=" * 80)
conclusions.append("DESCRIPTIVE STATISTICS AND SUMMARY ANALYSIS")
conclusions.append("=" * 80)
conclusions.append(f"\nDataset Shape: {df.shape[0]} rows × {df.shape[1]} columns\n")
# ========================================================================
# 1. DATA OVERVIEW AND QUALITY ASSESSMENT
# ========================================================================
print("\n1. Analyzing data quality and structure...")
# Create data quality summary
quality_summary = []
for col in df.columns:
null_count = df[col].isnull().sum()
null_pct = (null_count / len(df)) * 100
dtype = df[col].dtype
unique_count = df[col].nunique()
quality_summary.append({
'Column': col,
'Data_Type': str(dtype),
'Non_Null_Count': len(df) - null_count,
'Null_Count': null_count,
'Null_Percentage': round(null_pct, 2),
'Unique_Values': unique_count
})
quality_df = pd.DataFrame(quality_summary)
quality_df.to_csv('table_01_data_quality_summary.csv', index=False)
print(" Saved: table_01_data_quality_summary.csv")
conclusions.append("DATA QUALITY SUMMARY")
conclusions.append("-" * 80)
conclusions.append(f"Total columns: {len(df.columns)}")
conclusions.append(f"Columns with >50% missing data: {len(quality_df[quality_df['Null_Percentage'] > 50])}")
conclusions.append(f"Columns with >90% missing data: {len(quality_df[quality_df['Null_Percentage'] > 90])}")
high_missing = quality_df[quality_df['Null_Percentage'] > 50]['Column'].tolist()
if high_missing:
conclusions.append(f"\nColumns with high missing data (>50%): {', '.join(high_missing)}")
# ========================================================================
# 2. IDENTIFY AND ANALYZE NUMERIC COLUMNS
# ========================================================================
print("\n2. Analyzing numeric columns...")
# Try to convert object columns to numeric where possible
numeric_cols = []
for col in df.columns:
if df[col].dtype in ['int64', 'float64']:
numeric_cols.append(col)
elif df[col].dtype == 'object':
# Try to convert to numeric
try:
converted = pd.to_numeric(df[col], errors='coerce')
if converted.notna().sum() > len(df) * 0.1: # At least 10% valid numeric values
df[col + '_numeric'] = converted
numeric_cols.append(col + '_numeric')
except:
pass
if numeric_cols:
# Descriptive statistics for numeric columns
numeric_df = df[numeric_cols].select_dtypes(include=[np.number])
if not numeric_df.empty:
desc_stats = numeric_df.describe().T
desc_stats['missing'] = numeric_df.isnull().sum()
desc_stats['missing_pct'] = (desc_stats['missing'] / len(df)) * 100
desc_stats['skewness'] = numeric_df.skew()
desc_stats['kurtosis'] = numeric_df.kurtosis()
desc_stats.to_csv('table_02_numeric_descriptive_statistics.csv')
print(" Saved: table_02_numeric_descriptive_statistics.csv")
conclusions.append("\n\nNUMERIC VARIABLES ANALYSIS")
conclusions.append("-" * 80)
conclusions.append(f"Number of numeric columns analyzed: {len(numeric_df.columns)}")
for col in numeric_df.columns:
if numeric_df[col].notna().sum() > 0:
conclusions.append(f"\n{col}:")
conclusions.append(f" Mean: {numeric_df[col].mean():.2f}")
conclusions.append(f" Median: {numeric_df[col].median():.2f}")
conclusions.append(f" Std Dev: {numeric_df[col].std():.2f}")
conclusions.append(f" Range: [{numeric_df[col].min():.2f}, {numeric_df[col].max():.2f}]")
conclusions.append(f" Missing: {numeric_df[col].isnull().sum()} ({(numeric_df[col].isnull().sum()/len(df)*100):.1f}%)")
# ========================================================================
# 3. ANALYZE CATEGORICAL COLUMNS
# ========================================================================
print("\n3. Analyzing categorical columns...")
categorical_cols = df.select_dtypes(include=['object']).columns.tolist()
# Filter out columns with too many missing values or too many unique values
useful_categorical = []
for col in categorical_cols:
null_pct = (df[col].isnull().sum() / len(df)) * 100
unique_count = df[col].nunique()
if null_pct < 90 and 1 < unique_count < 100: # Reasonable categorical variables
useful_categorical.append(col)
if useful_categorical:
categorical_summary = []
for col in useful_categorical[:10]: # Limit to first 10 for manageability
value_counts = df[col].value_counts()
top_5 = value_counts.head(5)
for idx, (value, count) in enumerate(top_5.items()):
categorical_summary.append({
'Column': col,
'Rank': idx + 1,
'Value': str(value),
'Count': count,
'Percentage': round((count / len(df)) * 100, 2)
})
cat_summary_df = pd.DataFrame(categorical_summary)
cat_summary_df.to_csv('table_03_categorical_frequency_summary.csv', index=False)
print(" Saved: table_03_categorical_frequency_summary.csv")
conclusions.append("\n\nCATEGORICAL VARIABLES ANALYSIS")
conclusions.append("-" * 80)
conclusions.append(f"Number of categorical columns analyzed: {len(useful_categorical)}")
for col in useful_categorical[:5]: # Top 5 for conclusions
top_value = df[col].value_counts().index[0] if len(df[col].value_counts()) > 0 else "N/A"
top_count = df[col].value_counts().iloc[0] if len(df[col].value_counts()) > 0 else 0
conclusions.append(f"\n{col}:")
conclusions.append(f" Unique values: {df[col].nunique()}")
conclusions.append(f" Most frequent: '{top_value}' ({top_count} occurrences)")
conclusions.append(f" Missing: {df[col].isnull().sum()} ({(df[col].isnull().sum()/len(df)*100):.1f}%)")
# ========================================================================
# 4. VISUALIZATIONS
# ========================================================================
print("\n4. Creating visualizations...")
# Plot 1: Missing Data Heatmap
try:
plt.figure(figsize=(12, 8))
missing_data = df.isnull()
# Only show columns with some missing data
cols_with_missing = [col for col in df.columns if df[col].isnull().sum() > 0]
if cols_with_missing:
sns.heatmap(missing_data[cols_with_missing].head(100),
cbar=True,
yticklabels=False,
cmap='viridis')
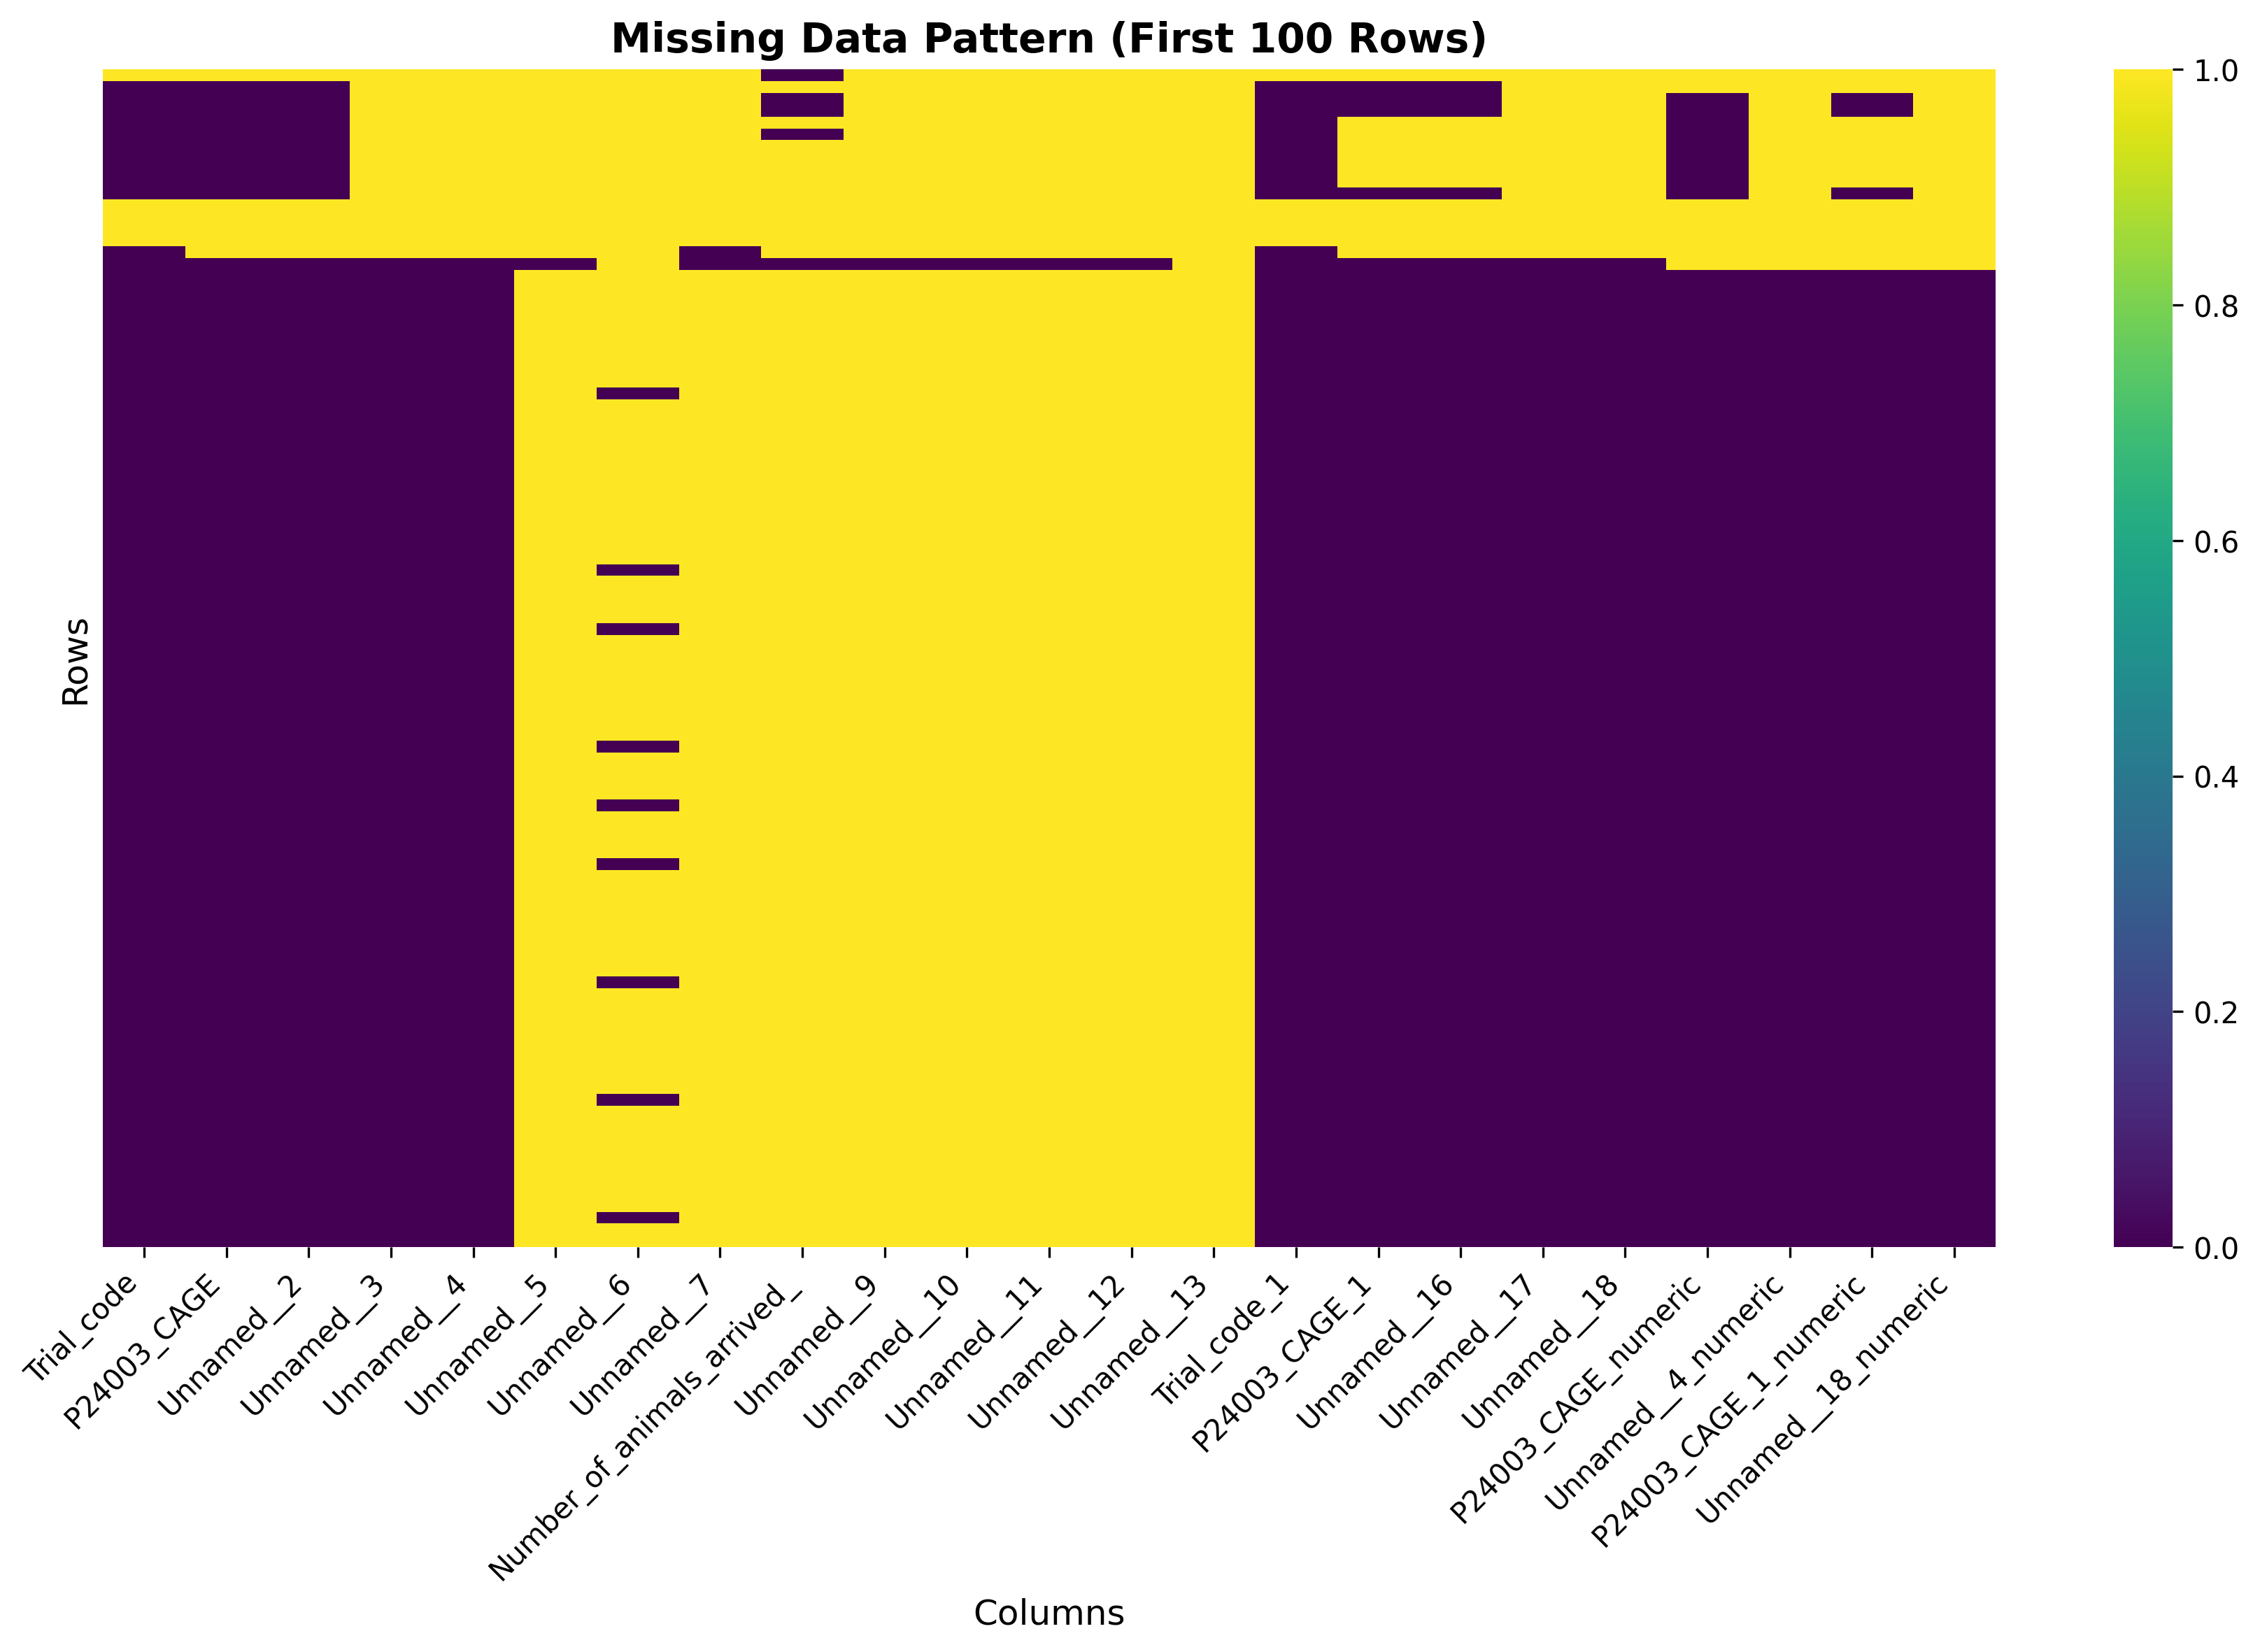
plt.title('Missing Data Pattern (First 100 Rows)', fontsize=14, fontweight='bold')
plt.xlabel('Columns', fontsize=12)
plt.ylabel('Rows', fontsize=12)
plt.xticks(rotation=45, ha='right')
plt.tight_layout()
plt.savefig('plot_01_missing_data_heatmap.png', dpi=300, bbox_inches='tight')
plt.close()
print(" Saved: plot_01_missing_data_heatmap.png")
except Exception as e:
print(f" Warning: Could not create missing data heatmap: {e}")
# Plot 2: Missing Data Bar Chart
try:
plt.figure(figsize=(12, 6))
missing_pct = (df.isnull().sum() / len(df) * 100).sort_values(ascending=False)
missing_pct = missing_pct[missing_pct > 0]
if len(missing_pct) > 0:
colors = ['red' if x > 50 else 'orange' if x > 20 else 'yellow' for x in missing_pct]
missing_pct.plot(kind='bar', color=colors)
plt.title('Percentage of Missing Data by Column', fontsize=14, fontweight='bold')
plt.xlabel('Columns', fontsize=12)
plt.ylabel('Missing Data (%)', fontsize=12)
plt.xticks(rotation=45, ha='right')
plt.axhline(y=50, color='r', linestyle='--', alpha=0.5, label='50% threshold')
plt.legend()
plt.tight_layout()
plt.savefig('plot_02_missing_data_percentage.png', dpi=300, bbox_inches='tight')
plt.close()
print(" Saved: plot_02_missing_data_percentage.png")
except Exception as e:
print(f" Warning: Could not create missing data bar chart: {e}")
# Plot 3: Numeric Variables Distribution
if numeric_cols:
try:
numeric_df_clean = df[numeric_cols].select_dtypes(include=[np.number])
# Remove columns with all NaN
numeric_df_clean = numeric_df_clean.dropna(axis=1, how='all')
if not numeric_df_clean.empty and len(numeric_df_clean.columns) > 0:
n_cols = min(len(numeric_df_clean.columns), 6) # Max 6 plots
fig, axes = plt.subplots(2, 3, figsize=(15, 10))
axes = axes.flatten()
for idx, col in enumerate(numeric_df_clean.columns[:n_cols]):
data = numeric_df_clean[col].dropna()
if len(data) > 0:
axes[idx].hist(data, bins=30, edgecolor='black', alpha=0.7, color='skyblue')
axes[idx].set_title(f'{col}\n(n={len(data)})', fontsize=10)
axes[idx].set_xlabel('Value', fontsize=9)
axes[idx].set_ylabel('Frequency', fontsize=9)
axes[idx].grid(alpha=0.3)
# Hide unused subplots
for idx in range(n_cols, 6):
axes[idx].axis('off')
plt.suptitle('Distribution of Numeric Variables', fontsize=14, fontweight='bold')
plt.tight_layout()
plt.savefig('plot_03_numeric_distributions.png', dpi=300, bbox_inches='tight')
plt.close()
print(" Saved: plot_03_numeric_distributions.png")
except Exception as e:
print(f" Warning: Could not create numeric distributions: {e}")
# Plot 4: Categorical Variables Bar Charts
if useful_categorical:
try:
n_plots = min(len(useful_categorical), 6)
fig, axes = plt.subplots(2, 3, figsize=(15, 10))
axes = axes.flatten()
for idx, col in enumerate(useful_categorical[:n_plots]):
value_counts = df[col].value_counts().head(10)
axes[idx].barh(range(len(value_counts)), value_counts.values, color='coral')
axes[idx].set_yticks(range(len(value_counts)))
axes[idx].set_yticklabels([str(x)[:20] for x in value_counts.index], fontsize=8)
axes[idx].set_xlabel('Count', fontsize=9)
axes[idx].set_title(f'{col}\n(Top 10 values)', fontsize=10)
axes[idx].grid(axis='x', alpha=0.3)
# Hide unused subplots
for idx in range(n_plots, 6):
axes[idx].axis('off')
plt.suptitle('Frequency of Categorical Variables', fontsize=14, fontweight='bold')
plt.tight_layout()
plt.savefig('plot_04_categorical_frequencies.png', dpi=300, bbox_inches='tight')
plt.close()
print(" Saved: plot_04_categorical_frequencies.png")
except Exception as e:
print(f" Warning: Could not create categorical frequencies: {e}")
# Plot 5: Correlation Heatmap (if numeric columns exist)
if numeric_cols:
try:
numeric_df_clean = df[numeric_cols].select_dtypes(include=[np.number])
numeric_df_clean = numeric_df_clean.dropna(axis=1, how='all')
if not numeric_df_clean.empty and len(numeric_df_clean.columns) > 1:
# Calculate correlation only for columns with sufficient data
corr_df = numeric_df_clean.loc[:, numeric_df_clean.notna().sum() > len(df) * 0.1]
if len(corr_df.columns) > 1:
correlation_matrix = corr_df.corr()
plt.figure(figsize=(10, 8))
sns.heatmap(correlation_matrix, annot=True, fmt='.2f',
cmap='coolwarm', center=0,
square=True, linewidths=1,
cbar_kws={"shrink": 0.8})
plt.title('Correlation Matrix of Numeric Variables', fontsize=14, fontweight='bold')
plt.tight_layout()
plt.savefig('plot_05_correlation_heatmap.png', dpi=300, bbox_inches='tight')
plt.close()
print(" Saved: plot_05_correlation_heatmap.png")
# Save correlation matrix as table
correlation_matrix.to_csv('table_04_correlation_matrix.csv')
print(" Saved: table_04_correlation_matrix.csv")
except Exception as e:
print(f" Warning: Could not create correlation heatmap: {e}")
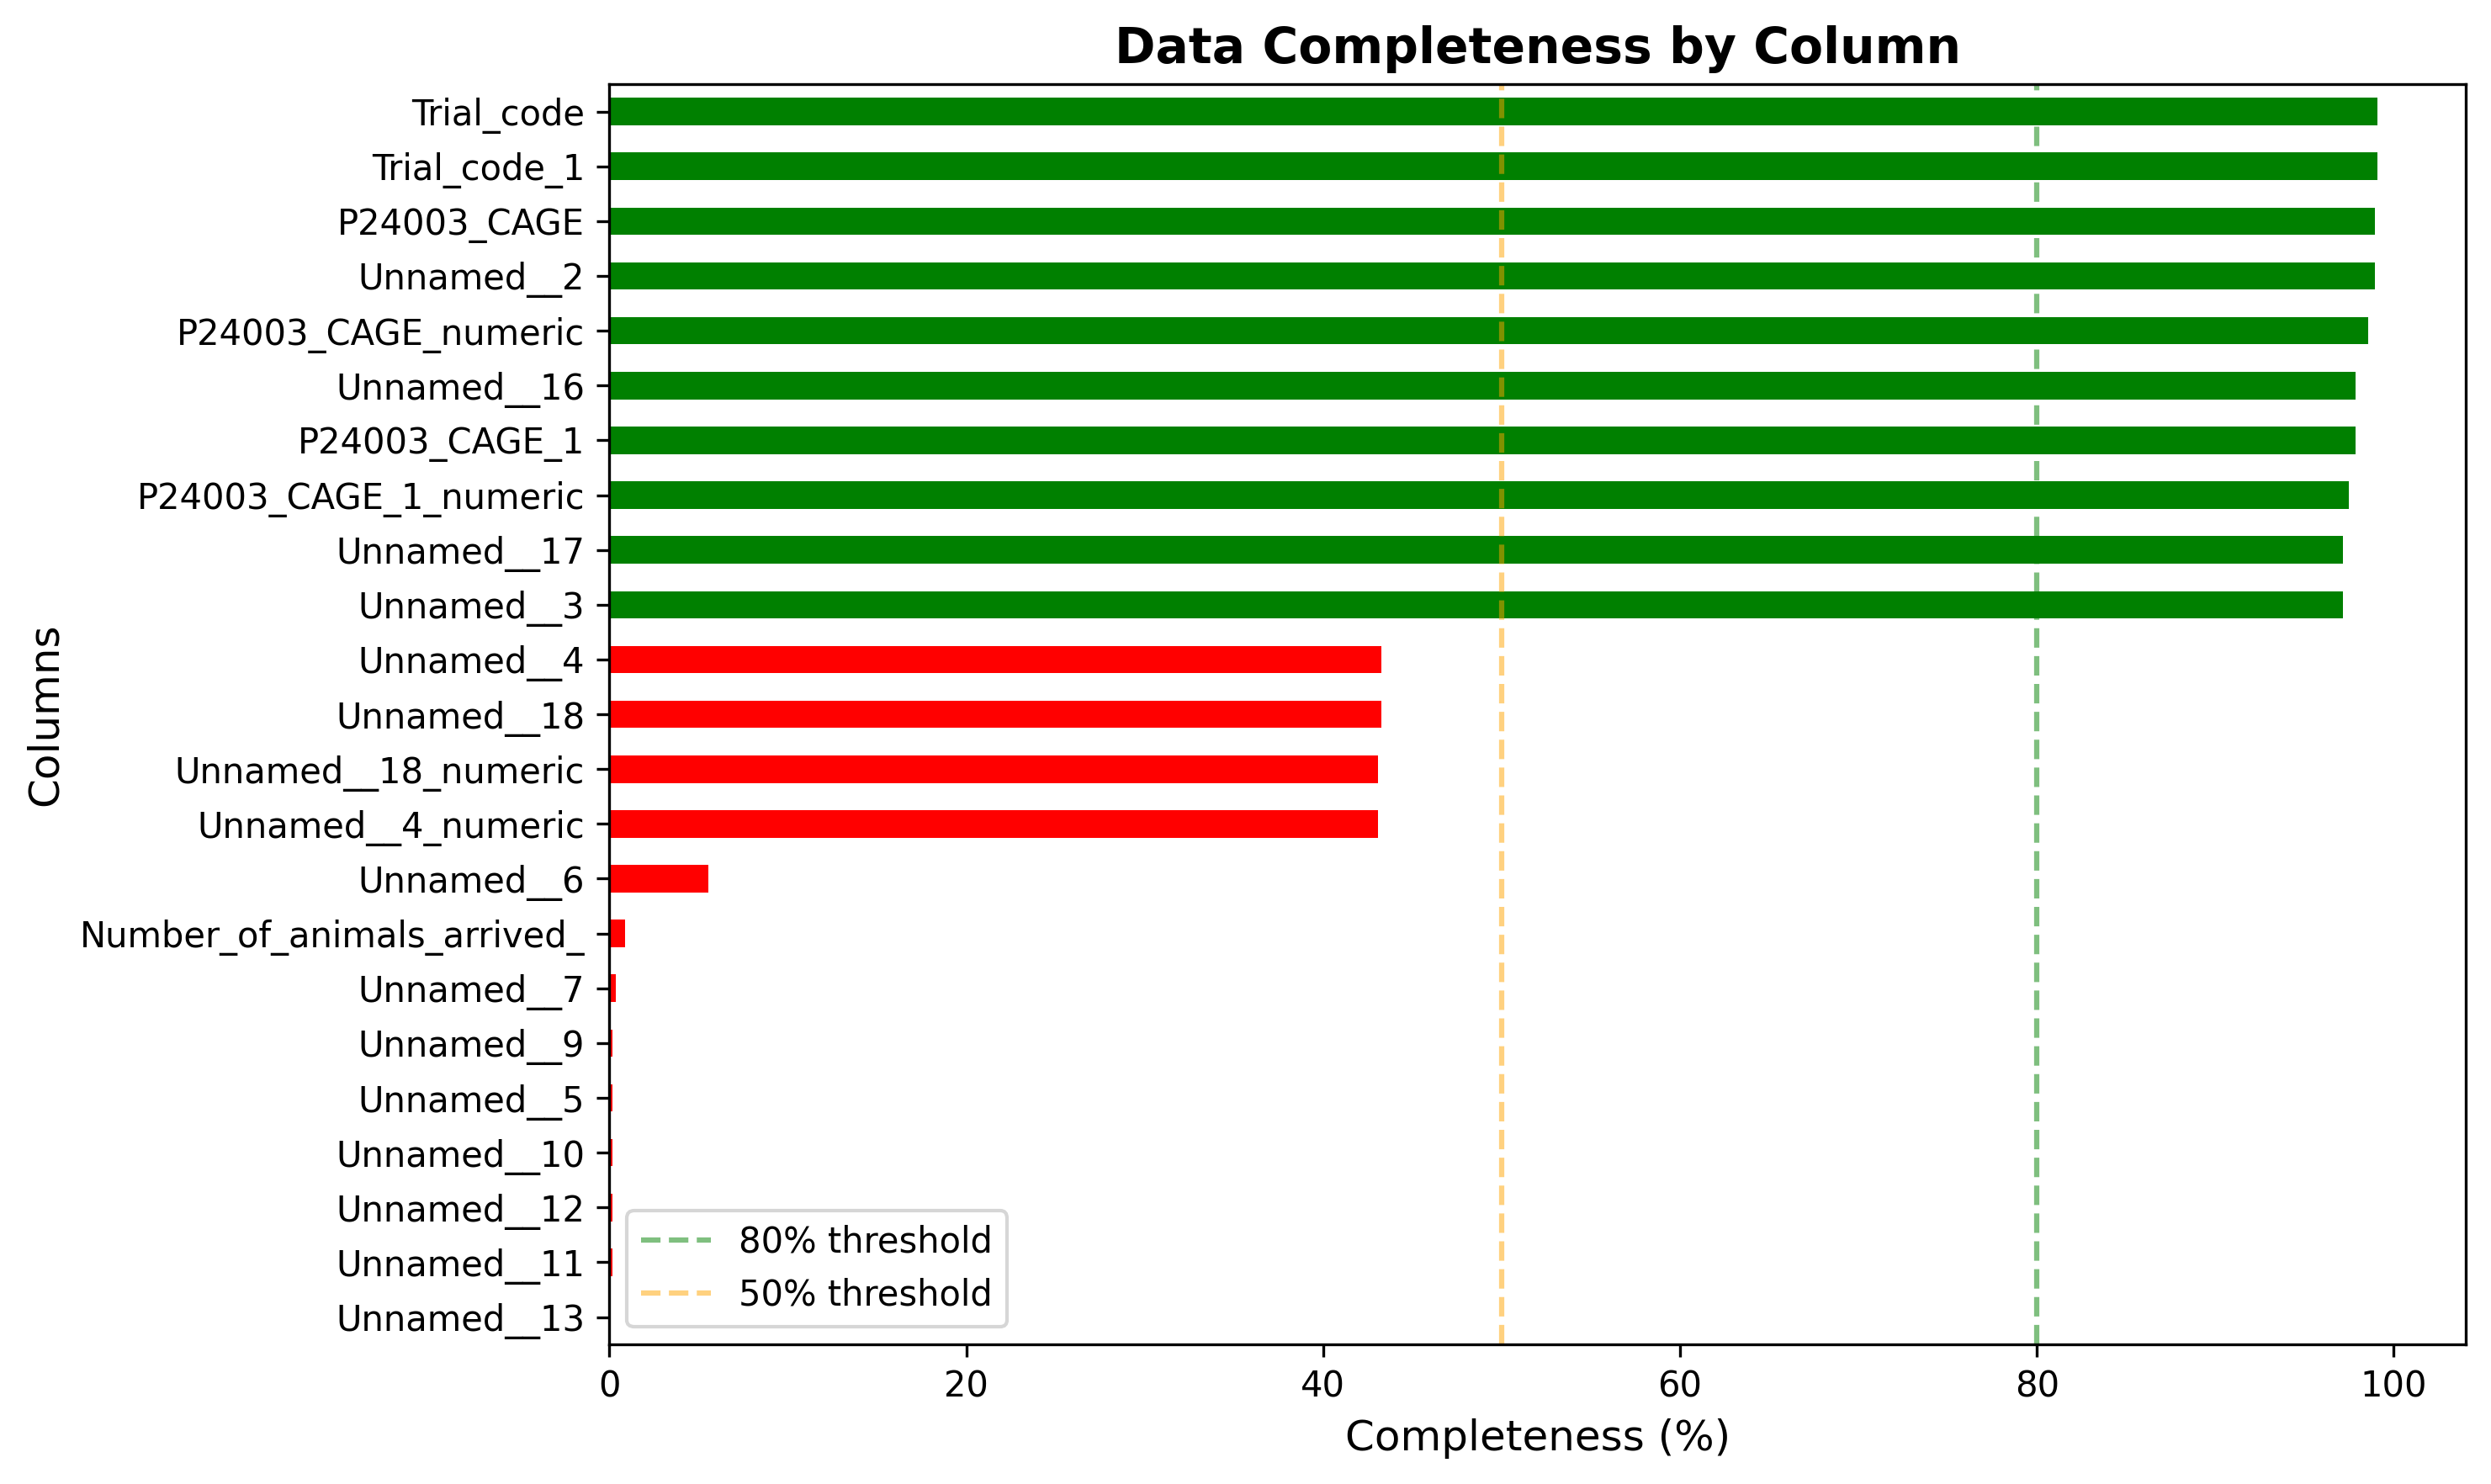
# Plot 6: Data Completeness Overview
try:
plt.figure(figsize=(10, 6))
completeness = ((df.notna().sum() / len(df)) * 100).sort_values(ascending=True)
colors = ['green' if x > 80 else 'orange' if x > 50 else 'red' for x in completeness]
completeness.plot(kind='barh', color=colors)
plt.title('Data Completeness by Column', fontsize=14, fontweight='bold')
plt.xlabel('Completeness (%)', fontsize=12)
plt.ylabel('Columns', fontsize=12)
plt.axvline(x=80, color='g', linestyle='--', alpha=0.5, label='80% threshold')
plt.axvline(x=50, color='orange', linestyle='--', alpha=0.5, label='50% threshold')
plt.legend()
plt.tight_layout()
plt.savefig('plot_06_data_completeness.png', dpi=300, bbox_inches='tight')
plt.close()
print(" Saved: plot_06_data_completeness.png")
except Exception as e:
print(f" Warning: Could not create data completeness plot: {e}")
# ========================================================================
# 5. ADDITIONAL SUMMARY STATISTICS
# ========================================================================
print("\n5. Generating additional summary statistics...")
# Overall dataset summary
overall_summary = {
'Metric': [
'Total Rows',
'Total Columns',
'Numeric Columns',
'Categorical Columns',
'Total Missing Values',
'Missing Data Percentage',
'Complete Rows',
'Complete Rows Percentage'
],
'Value': [
df.shape[0],
df.shape[1],
len(numeric_cols),
len(categorical_cols),
df.isnull().sum().sum(),
round((df.isnull().sum().sum() / (df.shape[0] * df.shape[1])) * 100, 2),
df.dropna().shape[0],
round((df.dropna().shape[0] / df.shape[0]) * 100, 2)
]
}
overall_df = pd.DataFrame(overall_summary)
overall_df.to_csv('table_05_overall_dataset_summary.csv', index=False)
print(" Saved: table_05_overall_dataset_summary.csv")
# ========================================================================
# 6. WRITE CONCLUSIONS
# ========================================================================
conclusions.append("\n\nOVERALL DATASET SUMMARY")
conclusions.append("-" * 80)
conclusions.append(f"Total observations: {df.shape[0]}")
conclusions.append(f"Total variables: {df.shape[1]}")
conclusions.append(f"Numeric variables: {len(numeric_cols)}")
conclusions.append(f"Categorical variables: {len(categorical_cols)}")
conclusions.append(f"\nData completeness: {round((df.dropna().shape[0] / df.shape[0]) * 100, 2)}% complete rows")
conclusions.append(f"Total missing values: {df.isnull().sum().sum()} ({round((df.isnull().sum().sum() / (df.shape[0] * df.shape[1])) * 100, 2)}%)")
conclusions.append("\n\nKEY FINDINGS")
conclusions.append("-" * 80)
# Identify columns with most missing data
high_missing_cols = quality_df[quality_df['Null_Percentage'] > 90].sort_values('Null_Percentage', ascending=False)
if len(high_missing_cols) > 0:
conclusions.append(f"\n1. High Missing Data Alert:")
conclusions.append(f" {len(high_missing_cols)} columns have >90% missing data.")
conclusions.append(f" These columns may not be useful for analysis.")
# Identify most complete columns
complete_cols = quality_df[quality_df['Null_Percentage'] < 10].sort_values('Null_Percentage')
if len(complete_cols) > 0:
conclusions.append(f"\n2. Most Complete Columns:")
conclusions.append(f" {len(complete_cols)} columns have <10% missing data.")
conclusions.append(f" These are the most reliable for analysis.")
# Data type distribution
conclusions.append(f"\n3. Data Type Distribution:")
conclusions.append(f" Object/String columns: {len(df.select_dtypes(include=['object']).columns)}")
conclusions.append(f" Numeric columns: {len(df.select_dtypes(include=[np.number]).columns)}")
conclusions.append("\n\nRECOMMENDATIONS")
conclusions.append("-" * 80)
conclusions.append("1. Consider removing columns with >90% missing data")
conclusions.append("2. Investigate the cause of missing data patterns")
conclusions.append("3. Focus analysis on columns with <20% missing data")
conclusions.append("4. Consider data imputation strategies for important variables")
conclusions.append("5. Verify data types and convert where appropriate")
conclusions.append("\n" + "=" * 80)
conclusions.append("END OF ANALYSIS")
conclusions.append("=" * 80)
# Write conclusions to file
with open('conclusions.txt', 'w') as f:
f.write('\n'.join(conclusions))
print("\n Saved: conclusions.txt")
print("\n" + "=" * 80)
print("Analysis completed successfully!")
print("=" * 80)
print("\nGenerated files:")
print(" - table_01_data_quality_summary.csv")
if numeric_cols:
print(" - table_02_numeric_descriptive_statistics.csv")
if useful_categorical:
print(" - table_03_categorical_frequency_summary.csv")
if numeric_cols and len(numeric_cols) > 1:
print(" - table_04_correlation_matrix.csv")
print(" - table_05_overall_dataset_summary.csv")
print(" - plot_01_missing_data_heatmap.png")
print(" - plot_02_missing_data_percentage.png")
if numeric_cols:
print(" - plot_03_numeric_distributions.png")
if useful_categorical:
print(" - plot_04_categorical_frequencies.png")
if numeric_cols and len(numeric_cols) > 1:
print(" - plot_05_correlation_heatmap.png")
print(" - plot_06_data_completeness.png")
print(" - conclusions.txt")
print("\n" + "=" * 80)
if __name__ == "__main__":
main()Execution Console
SmartStat Analysis Console
Session: 7dd5c71e-d110-42ad-bf10-798e37bb0263
Ready for analysis...